CISCO, TX ZIP Code
| City | CISCO |
| State | Texas |
| ZIP Codes count | 1 (see all) |
| Post offices count | 1 (see all) |
| Total population | 3,766 (see all) |
ZIP Code in CISCO, Texas
76437
This list contains only 5-digit ZIP codes. Use our zip code lookup by address feature to get the full 9-digit (ZIP+4) code.
List of CISCO, TX ZIP Codes
| ZIP | TYPE | POPU |
|---|---|---|
| 76437 | STANDARD | 5,593 |
Post offices
CISCO — Post Office™ 206 W 6TH ST CISCO, TX 76437-9998 |
Envelope example
On the bottom center of the envelope, write the address you want your letter delivered to. Include the following on separate lines:
- Recipient's full name
- Full street address
- City, State, and ZIP Code
Using the same format, write the return address in the top left corner.
Using the full ZIP+4 Code when mailing via the USPS ensures the fastest, most accurate mailing possible. If you are not sure of the full 9-digit ZIP Code, use the 5-digit ZIP Code to avoid loss of letter or package.
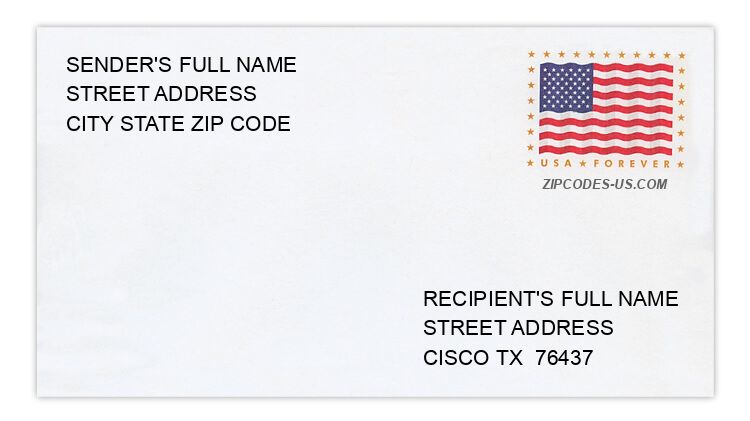
The recipient address information is provided for your reference.
Address example
293 AVENUE F
CISCO TX 76437-2416
CISCO TX 76437-2416
1511 COUNTY ROAD 145
CISCO TX 76437-6625
CISCO TX 76437-6625
229 COUNTY ROAD 163
CISCO TX 76437-6220
CISCO TX 76437-6220
1308 FRONT ST
CISCO TX 76437-3634
CISCO TX 76437-3634
233 PRIVATE ROAD 1835
CISCO TX 76437-8908
CISCO TX 76437-8908
1330 W 12TH ST
CISCO TX 76437-3610
CISCO TX 76437-3610
Map
Hover over the map to see the ZIP code
Census data for CISCO, TX
Demographic and housing estimates in CISCO, TX
| Total population | 3,766 |
| Male | 1,703 |
| Female | 2,063 |
| Total population | 3,766 |
| Under 5 years | 268 |
| 5 to 9 years | 122 |
| 10 to 14 years | 151 |
| 15 to 19 years | 456 |
| 20 to 24 years | 203 |
| 25 to 34 years | 344 |
| 35 to 44 years | 316 |
| 45 to 54 years | 545 |
| 55 to 59 years | 280 |
| 60 to 64 years | 144 |
| 65 to 74 years | 392 |
| 75 to 84 years | 333 |
| 85 years and over | 212 |
| Median age (years) | 45.4 |
| Under 18 years | 700 |
| 16 years and over | 3,225 |
| 18 years and over | 3,066 |
| 21 years and over | 2,696 |
| 62 years and over | 990 |
| 65 years and over | 937 |
| Total population | 3,766 |
| One race | 3,753 |
| White | 3,246 |
| Black or African American | 206 |
| American Indian and Alaska Native | 50 |
| Asian | 0 |
| Native Hawaiian and Other Pacific Islander | 0 |
| Some other race | 251 |
| Two or more races | 13 |
| Citizen, VOTING AGE 18 and over population | 3,059 |
| Male Citizen, VOTING AGE 18 and over population | 1,523 |
| Female Citizen, VOTING AGE 18 and over population | 1,536 |
Social characteristics in CISCO, TX
| Total households | 1,523 |
| Family households (families) | 869 |
| Married-couple family | 689 |
| Male householder, no wife present, family | 0 |
| Female householder, no husband present, family | 180 |
| Nonfamily households | 654 |
| Average household size | 2.22 |
| Average family size | 3.00 |
Economic characteristics in CISCO, TX
| Total households | 1,523 |
| Less than $10,000 | 156 |
| $10,000 to $14,999 | 88 |
| $15,000 to $24,999 | 330 |
| $25,000 to $34,999 | 180 |
| $35,000 to $49,999 | 271 |
| $50,000 to $74,999 | 144 |
| $75,000 to $99,999 | 111 |
| $100,000 to $149,999 | 98 |
| $150,000 to $199,999 | 126 |
| $200,000 or more | 19 |
| Median household income (dollars) | 35,240 |
Housing characteristics in CISCO, TX
| Total housing units | 1,821 |
| Occupied housing units | 1,523 |
| Vacant housing units | 298 |
| Total housing units | 1,821 |
| 1-unit, detached | 1,350 |
| 1-unit, attached | 44 |
| 2 units | 0 |
| 3 or 4 units | 55 |
| 5 to 9 units | 68 |
| 10 to 19 units | 0 |
| 20 or more units | 0 |
| Mobile home | 304 |
| Boat, RV, van, etc. | 0 |
| Total housing units | 1,821 |
| Built 2014 or later | 119 |
| Built 2010 to 2013 | 0 |
| Built 2000 to 2009 | 26 |
| Built 1990 to 1999 | 48 |
| Built 1980 to 1989 | 194 |
| Built 1970 to 1979 | 203 |
| Built 1960 to 1969 | 359 |
| Built 1950 to 1959 | 350 |
| Built 1940 to 1949 | 306 |
| Built 1939 or earlier | 216 |
| Total housing units | 1,821 |
| 1 room | 56 |
| 2 rooms | 0 |
| 3 rooms | 122 |
| 4 rooms | 318 |
| 5 rooms | 549 |
| 6 rooms | 394 |
| 7 rooms | 212 |
| 8 rooms | 35 |
| 9 rooms or more | 135 |
| Median rooms | 5.3 |
| Total housing units | 1,821 |
| No bedroom | 56 |
| 1 bedroom | 65 |
| 2 bedrooms | 742 |
| 3 bedrooms | 724 |
| 4 bedrooms | 229 |
| 5 or more bedrooms | 5 |
| Occupied housing units | 1,523 |
| Owner-occupied | 1,101 |
| Renter-occupied | 422 |
| Average household size of owner-occupied unit | 2.27 |
| Average household size of renter-occupied unit | 2.09 |
| Occupied housing units | 1,523 |
| Moved in 2017 or later | 29 |
| Moved in 2015 to 2016 | 182 |
| Moved in 2010 to 2014 | 514 |
| Moved in 2000 to 2009 | 373 |
| Moved in 1990 to 1999 | 197 |
| Moved in 1989 and earlier | 228 |
| Owner-occupied units | 1,101 |
| Less than $50,000 | 447 |
| $50,000 to $99,999 | 372 |
| $100,000 to $149,999 | 52 |
| $150,000 to $199,999 | 116 |
| $200,000 to $299,999 | 94 |
| $300,000 to $499,999 | 15 |
| $500,000 to $999,999 | 5 |
| $1,000,000 or more | 0 |
| Median (dollars) | 60,500 |
| Owner-occupied units | 1,101 |
| Housing units with a mortgage | 296 |
| Housing units without a mortgage | 805 |
| Occupied units paying rent | 339 |
| Less than $500 | 96 |
| $500 to $999 | 243 |
| $1,000 to $1,499 | 0 |
| $1,500 to $1,999 | 0 |
| $2,000 to $2,499 | 0 |
| $2,500 to $2,999 | 0 |
| $3,000 or more | 0 |
| Median (dollars) | 598 |
| No rent paid | 83 |
Data is based on 2018 Census
ZIP Codes for other locations
State for CISCO
Texas ZIP CodesOther cities in Texas