LULING, TX ZIP Code
| City | LULING |
| State | Texas |
| ZIP Codes count | 1 (see all) |
| Post offices count | 1 (see all) |
| Total population | 5,779 (see all) |
ZIP Code in LULING, Texas
78648
This list contains only 5-digit ZIP codes. Use our zip code lookup by address feature to get the full 9-digit (ZIP+4) code.
List of LULING, TX ZIP Codes
| ZIP | TYPE | POPU |
|---|---|---|
| 78648 | STANDARD | 7,803 |
Post offices
LULING — Post Office™ 517 E CROCKETT ST LULING, TX 78648-9998 |
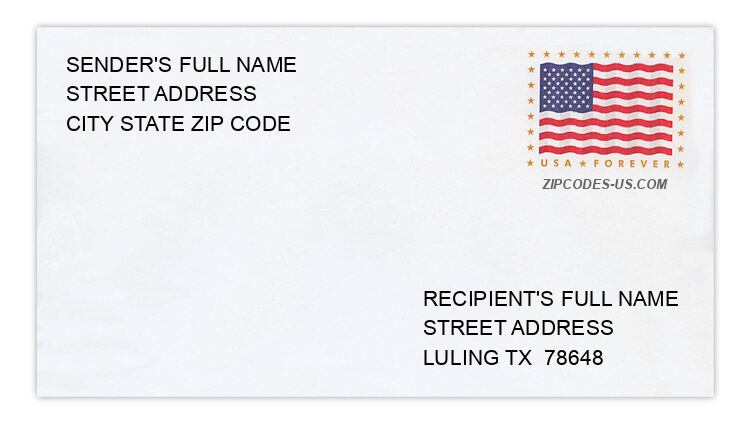
Envelope example
On the bottom center of the envelope, write the address you want your letter delivered to. Include the following on separate lines:
- Recipient's full name
- Full street address
- City, State, and ZIP Code
Using the same format, write the return address in the top left corner.
Using the full ZIP+4 Code when mailing via the USPS ensures the fastest, most accurate mailing possible. If you are not sure of the full 9-digit ZIP Code, use the 5-digit ZIP Code to avoid loss of letter or package.
The recipient address information is provided for your reference.
Address example
309 DAISY AVE
LULING TX 78648-2122
LULING TX 78648-2122
709 E HOUSTON ST
LULING TX 78648-3011
LULING TX 78648-3011
269 HILLCREST DR
LULING TX 78648-3526
LULING TX 78648-3526
640 S PECAN AVE
LULING TX 78648-3329
LULING TX 78648-3329
642 SCENIC VIEW RD
LULING TX 78648-1774
LULING TX 78648-1774
210 SPRUCE AVE
LULING TX 78648-2028
LULING TX 78648-2028
Map
Hover over the map to see the ZIP code
Census data for LULING, TX
Demographic and housing estimates in LULING, TX
| Total population | 5,779 |
| Male | 2,709 |
| Female | 3,070 |
| Total population | 5,779 |
| Under 5 years | 590 |
| 5 to 9 years | 438 |
| 10 to 14 years | 196 |
| 15 to 19 years | 352 |
| 20 to 24 years | 441 |
| 25 to 34 years | 872 |
| 35 to 44 years | 525 |
| 45 to 54 years | 805 |
| 55 to 59 years | 512 |
| 60 to 64 years | 295 |
| 65 to 74 years | 328 |
| 75 to 84 years | 283 |
| 85 years and over | 142 |
| Median age (years) | 35.0 |
| Under 18 years | 1,440 |
| 16 years and over | 4,489 |
| 18 years and over | 4,339 |
| 21 years and over | 3,999 |
| 62 years and over | 930 |
| 65 years and over | 753 |
| Total population | 5,779 |
| One race | 5,779 |
| White | 4,133 |
| Black or African American | 487 |
| American Indian and Alaska Native | 0 |
| Asian | 33 |
| Native Hawaiian and Other Pacific Islander | 22 |
| Some other race | 1,104 |
| Two or more races | 0 |
| Citizen, VOTING AGE 18 and over population | 3,850 |
| Male Citizen, VOTING AGE 18 and over population | 1,732 |
| Female Citizen, VOTING AGE 18 and over population | 2,118 |
Social characteristics in LULING, TX
| Total households | 2,008 |
| Family households (families) | 1,600 |
| Married-couple family | 998 |
| Male householder, no wife present, family | 59 |
| Female householder, no husband present, family | 543 |
| Nonfamily households | 408 |
| Average household size | 2.78 |
| Average family size | 3.04 |
Economic characteristics in LULING, TX
| Total households | 2,008 |
| Less than $10,000 | 235 |
| $10,000 to $14,999 | 203 |
| $15,000 to $24,999 | 237 |
| $25,000 to $34,999 | 180 |
| $35,000 to $49,999 | 269 |
| $50,000 to $74,999 | 324 |
| $75,000 to $99,999 | 113 |
| $100,000 to $149,999 | 265 |
| $150,000 to $199,999 | 147 |
| $200,000 or more | 35 |
| Median household income (dollars) | 46,019 |
Housing characteristics in LULING, TX
| Total housing units | 2,208 |
| Occupied housing units | 2,008 |
| Vacant housing units | 200 |
| Total housing units | 2,208 |
| 1-unit, detached | 1,547 |
| 1-unit, attached | 45 |
| 2 units | 98 |
| 3 or 4 units | 53 |
| 5 to 9 units | 39 |
| 10 to 19 units | 100 |
| 20 or more units | 32 |
| Mobile home | 294 |
| Boat, RV, van, etc. | 0 |
| Total housing units | 2,208 |
| Built 2014 or later | 0 |
| Built 2010 to 2013 | 153 |
| Built 2000 to 2009 | 276 |
| Built 1990 to 1999 | 115 |
| Built 1980 to 1989 | 88 |
| Built 1970 to 1979 | 338 |
| Built 1960 to 1969 | 120 |
| Built 1950 to 1959 | 419 |
| Built 1940 to 1949 | 422 |
| Built 1939 or earlier | 277 |
| Total housing units | 2,208 |
| 1 room | 40 |
| 2 rooms | 0 |
| 3 rooms | 117 |
| 4 rooms | 594 |
| 5 rooms | 731 |
| 6 rooms | 443 |
| 7 rooms | 107 |
| 8 rooms | 79 |
| 9 rooms or more | 97 |
| Median rooms | 5.0 |
| Total housing units | 2,208 |
| No bedroom | 40 |
| 1 bedroom | 61 |
| 2 bedrooms | 788 |
| 3 bedrooms | 1,138 |
| 4 bedrooms | 181 |
| 5 or more bedrooms | 0 |
| Occupied housing units | 2,008 |
| Owner-occupied | 1,162 |
| Renter-occupied | 846 |
| Average household size of owner-occupied unit | 2.66 |
| Average household size of renter-occupied unit | 2.95 |
| Occupied housing units | 2,008 |
| Moved in 2017 or later | 30 |
| Moved in 2015 to 2016 | 303 |
| Moved in 2010 to 2014 | 526 |
| Moved in 2000 to 2009 | 520 |
| Moved in 1990 to 1999 | 252 |
| Moved in 1989 and earlier | 377 |
| Owner-occupied units | 1,162 |
| Less than $50,000 | 323 |
| $50,000 to $99,999 | 303 |
| $100,000 to $149,999 | 235 |
| $150,000 to $199,999 | 124 |
| $200,000 to $299,999 | 141 |
| $300,000 to $499,999 | 24 |
| $500,000 to $999,999 | 12 |
| $1,000,000 or more | 0 |
| Median (dollars) | 89,000 |
| Owner-occupied units | 1,162 |
| Housing units with a mortgage | 537 |
| Housing units without a mortgage | 625 |
| Occupied units paying rent | 809 |
| Less than $500 | 160 |
| $500 to $999 | 443 |
| $1,000 to $1,499 | 206 |
| $1,500 to $1,999 | 0 |
| $2,000 to $2,499 | 0 |
| $2,500 to $2,999 | 0 |
| $3,000 or more | 0 |
| Median (dollars) | 711 |
| No rent paid | 37 |
Data is based on 2018 Census
ZIP Codes for other locations
State for LULING
Texas ZIP CodesOther cities in Texas