MANSFIELD, TX ZIP Code
| City | MANSFIELD |
| State | Texas |
| ZIP Codes count | 1 (see all) |
| Post offices count | 1 (see all) |
| Total population | 67,492 (see all) |
ZIP Code in MANSFIELD, Texas
76063
This list contains only 5-digit ZIP codes. Use our zip code lookup by address feature to get the full 9-digit (ZIP+4) code.
List of MANSFIELD, TX ZIP Codes
| ZIP | TYPE | POPU |
|---|---|---|
| 76063 | STANDARD | 76,867 |
Post offices
MANSFIELD — Post Office™ 752 N MAIN ST MANSFIELD, TX 76063-3203 |
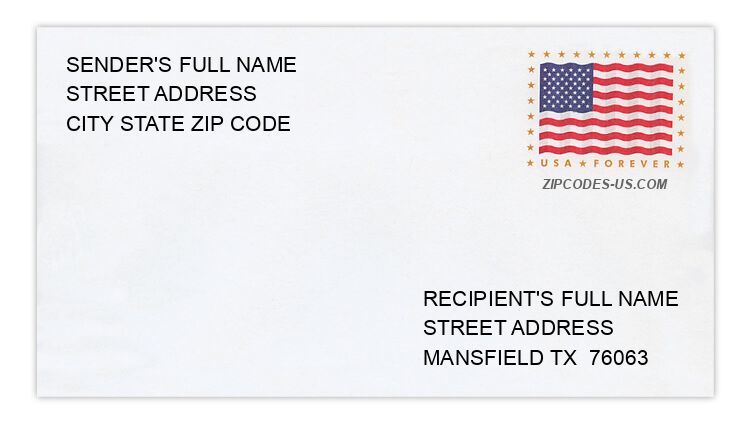
Envelope example
On the bottom center of the envelope, write the address you want your letter delivered to. Include the following on separate lines:
- Recipient's full name
- Full street address
- City, State, and ZIP Code
Using the same format, write the return address in the top left corner.
Using the full ZIP+4 Code when mailing via the USPS ensures the fastest, most accurate mailing possible. If you are not sure of the full 9-digit ZIP Code, use the 5-digit ZIP Code to avoid loss of letter or package.
The recipient address information is provided for your reference.
Address example
449 CLEAR CREEK DR
MANSFIELD TX 76063-2090
MANSFIELD TX 76063-2090
2568 N MAIN ST
MANSFIELD TX 76063-3942
MANSFIELD TX 76063-3942
83 PINEDALE DR
MANSFIELD TX 76063-6776
MANSFIELD TX 76063-6776
4883 SLIDE ROCK CT
MANSFIELD TX 76063-6796
MANSFIELD TX 76063-6796
349 STEWART ST
MANSFIELD TX 76063-3116
MANSFIELD TX 76063-3116
3159 SUMMER GROVE CT
MANSFIELD TX 76063-7547
MANSFIELD TX 76063-7547
Map
Hover over the map to see the ZIP code
Census data for MANSFIELD, TX
Demographic and housing estimates in MANSFIELD, TX
| Total population | 67,492 |
| Male | 32,419 |
| Female | 35,073 |
| Total population | 67,492 |
| Under 5 years | 4,178 |
| 5 to 9 years | 4,946 |
| 10 to 14 years | 6,536 |
| 15 to 19 years | 6,122 |
| 20 to 24 years | 3,369 |
| 25 to 34 years | 7,301 |
| 35 to 44 years | 11,776 |
| 45 to 54 years | 9,606 |
| 55 to 59 years | 4,393 |
| 60 to 64 years | 2,971 |
| 65 to 74 years | 3,856 |
| 75 to 84 years | 1,854 |
| 85 years and over | 584 |
| Median age (years) | 36.3 |
| Under 18 years | 19,686 |
| 16 years and over | 50,393 |
| 18 years and over | 47,806 |
| 21 years and over | 44,786 |
| 62 years and over | 7,969 |
| 65 years and over | 6,294 |
| Total population | 67,492 |
| One race | 64,601 |
| White | 46,464 |
| Black or African American | 12,071 |
| American Indian and Alaska Native | 246 |
| Asian | 2,937 |
| Native Hawaiian and Other Pacific Islander | 45 |
| Some other race | 2,838 |
| Two or more races | 2,891 |
| Citizen, VOTING AGE 18 and over population | 45,287 |
| Male Citizen, VOTING AGE 18 and over population | 21,887 |
| Female Citizen, VOTING AGE 18 and over population | 23,400 |
Social characteristics in MANSFIELD, TX
| Total households | 21,856 |
| Family households (families) | 17,716 |
| Married-couple family | 14,484 |
| Male householder, no wife present, family | 819 |
| Female householder, no husband present, family | 2,413 |
| Nonfamily households | 4,140 |
| Average household size | 3.07 |
| Average family size | 3.42 |
Economic characteristics in MANSFIELD, TX
| Total households | 21,856 |
| Less than $10,000 | 460 |
| $10,000 to $14,999 | 277 |
| $15,000 to $24,999 | 727 |
| $25,000 to $34,999 | 1,278 |
| $35,000 to $49,999 | 1,682 |
| $50,000 to $74,999 | 3,395 |
| $75,000 to $99,999 | 3,622 |
| $100,000 to $149,999 | 5,302 |
| $150,000 to $199,999 | 2,523 |
| $200,000 or more | 2,590 |
| Median household income (dollars) | 96,253 |
Housing characteristics in MANSFIELD, TX
| Total housing units | 22,752 |
| Occupied housing units | 21,856 |
| Vacant housing units | 896 |
| Total housing units | 22,752 |
| 1-unit, detached | 18,564 |
| 1-unit, attached | 356 |
| 2 units | 217 |
| 3 or 4 units | 98 |
| 5 to 9 units | 435 |
| 10 to 19 units | 1,326 |
| 20 or more units | 1,220 |
| Mobile home | 536 |
| Boat, RV, van, etc. | 0 |
| Total housing units | 22,752 |
| Built 2014 or later | 1,007 |
| Built 2010 to 2013 | 1,895 |
| Built 2000 to 2009 | 10,287 |
| Built 1990 to 1999 | 4,202 |
| Built 1980 to 1989 | 2,794 |
| Built 1970 to 1979 | 1,375 |
| Built 1960 to 1969 | 383 |
| Built 1950 to 1959 | 414 |
| Built 1940 to 1949 | 168 |
| Built 1939 or earlier | 227 |
| Total housing units | 22,752 |
| 1 room | 221 |
| 2 rooms | 230 |
| 3 rooms | 1,296 |
| 4 rooms | 1,693 |
| 5 rooms | 3,560 |
| 6 rooms | 3,882 |
| 7 rooms | 3,358 |
| 8 rooms | 3,049 |
| 9 rooms or more | 5,463 |
| Median rooms | 6.6 |
| Total housing units | 22,752 |
| No bedroom | 221 |
| 1 bedroom | 1,376 |
| 2 bedrooms | 2,327 |
| 3 bedrooms | 8,780 |
| 4 bedrooms | 7,498 |
| 5 or more bedrooms | 2,550 |
| Occupied housing units | 21,856 |
| Owner-occupied | 16,600 |
| Renter-occupied | 5,256 |
| Average household size of owner-occupied unit | 3.24 |
| Average household size of renter-occupied unit | 2.55 |
| Occupied housing units | 21,856 |
| Moved in 2017 or later | 1,229 |
| Moved in 2015 to 2016 | 3,116 |
| Moved in 2010 to 2014 | 6,539 |
| Moved in 2000 to 2009 | 7,701 |
| Moved in 1990 to 1999 | 2,269 |
| Moved in 1989 and earlier | 1,002 |
| Owner-occupied units | 16,600 |
| Less than $50,000 | 365 |
| $50,000 to $99,999 | 674 |
| $100,000 to $149,999 | 1,641 |
| $150,000 to $199,999 | 3,199 |
| $200,000 to $299,999 | 6,012 |
| $300,000 to $499,999 | 4,062 |
| $500,000 to $999,999 | 517 |
| $1,000,000 or more | 130 |
| Median (dollars) | 235,300 |
| Owner-occupied units | 16,600 |
| Housing units with a mortgage | 12,560 |
| Housing units without a mortgage | 4,040 |
| Occupied units paying rent | 5,117 |
| Less than $500 | 120 |
| $500 to $999 | 878 |
| $1,000 to $1,499 | 2,037 |
| $1,500 to $1,999 | 1,427 |
| $2,000 to $2,499 | 389 |
| $2,500 to $2,999 | 182 |
| $3,000 or more | 84 |
| Median (dollars) | 1,384 |
| No rent paid | 139 |
Data is based on 2018 Census
ZIP Codes for other locations
State for MANSFIELD
Texas ZIP CodesOther cities in Texas