MANVEL, TX ZIP Code
| City | MANVEL |
| State | Texas |
| ZIP Codes count | 1 (see all) |
| Post offices count | 1 (see all) |
| Total population | 9,143 (see all) |
ZIP Code in MANVEL, Texas
77578
This list contains only 5-digit ZIP codes. Use our zip code lookup by address feature to get the full 9-digit (ZIP+4) code.
List of MANVEL, TX ZIP Codes
| ZIP | TYPE | POPU |
|---|---|---|
| 77578 | STANDARD | 23,444 |
Post offices
MANVEL — Post Office™ 6925 MASTERS RD MANVEL, TX 77578-9998 |
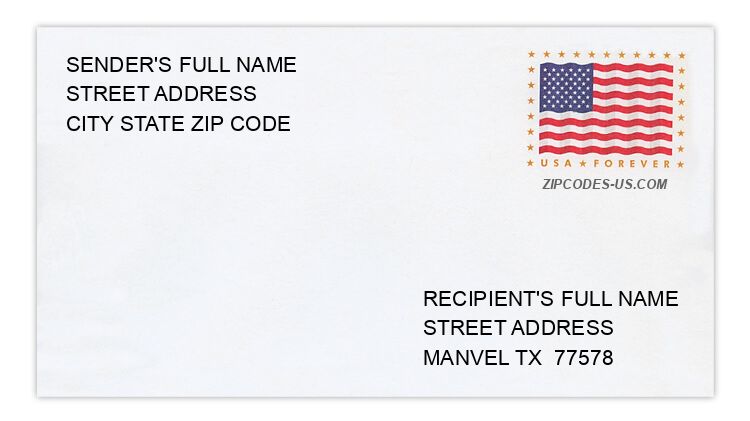
Envelope example
On the bottom center of the envelope, write the address you want your letter delivered to. Include the following on separate lines:
- Recipient's full name
- Full street address
- City, State, and ZIP Code
Using the same format, write the return address in the top left corner.
Using the full ZIP+4 Code when mailing via the USPS ensures the fastest, most accurate mailing possible. If you are not sure of the full 9-digit ZIP Code, use the 5-digit ZIP Code to avoid loss of letter or package.
The recipient address information is provided for your reference.
Address example
3541 DUSTY CT
MANVEL TX 77578-3675
MANVEL TX 77578-3675
3693 KILGORE CT
MANVEL TX 77578-3190
MANVEL TX 77578-3190
2925 PAYTON SPRINGS DR
MANVEL TX 77578-3252
MANVEL TX 77578-3252
2819 RIDGE FALLS DR
MANVEL TX 77578-4269
MANVEL TX 77578-4269
3893 SADDLE HORN CT
MANVEL TX 77578-3363
MANVEL TX 77578-3363
7569 SCOTT AVE
MANVEL TX 77578-3939
MANVEL TX 77578-3939
Map
Hover over the map to see the ZIP code
Census data for MANVEL, TX
Demographic and housing estimates in MANVEL, TX
| Total population | 9,143 |
| Male | 4,307 |
| Female | 4,836 |
| Total population | 9,143 |
| Under 5 years | 787 |
| 5 to 9 years | 645 |
| 10 to 14 years | 1,021 |
| 15 to 19 years | 912 |
| 20 to 24 years | 318 |
| 25 to 34 years | 1,470 |
| 35 to 44 years | 1,265 |
| 45 to 54 years | 1,102 |
| 55 to 59 years | 496 |
| 60 to 64 years | 337 |
| 65 to 74 years | 607 |
| 75 to 84 years | 92 |
| 85 years and over | 91 |
| Median age (years) | 30.4 |
| Under 18 years | 3,175 |
| 16 years and over | 6,432 |
| 18 years and over | 5,968 |
| 21 years and over | 5,733 |
| 62 years and over | 946 |
| 65 years and over | 790 |
| Total population | 9,143 |
| One race | 9,018 |
| White | 5,675 |
| Black or African American | 1,893 |
| American Indian and Alaska Native | 179 |
| Asian | 446 |
| Native Hawaiian and Other Pacific Islander | 0 |
| Some other race | 825 |
| Two or more races | 125 |
| Citizen, VOTING AGE 18 and over population | 5,724 |
| Male Citizen, VOTING AGE 18 and over population | 2,660 |
| Female Citizen, VOTING AGE 18 and over population | 3,064 |
Social characteristics in MANVEL, TX
| Total households | 2,783 |
| Family households (families) | 2,141 |
| Married-couple family | 1,745 |
| Male householder, no wife present, family | 208 |
| Female householder, no husband present, family | 188 |
| Nonfamily households | 642 |
| Average household size | 3.29 |
| Average family size | 3.85 |
Economic characteristics in MANVEL, TX
| Total households | 2,783 |
| Less than $10,000 | 15 |
| $10,000 to $14,999 | 13 |
| $15,000 to $24,999 | 120 |
| $25,000 to $34,999 | 122 |
| $35,000 to $49,999 | 246 |
| $50,000 to $74,999 | 375 |
| $75,000 to $99,999 | 526 |
| $100,000 to $149,999 | 1,018 |
| $150,000 to $199,999 | 131 |
| $200,000 or more | 217 |
| Median household income (dollars) | 94,956 |
Housing characteristics in MANVEL, TX
| Total housing units | 3,195 |
| Occupied housing units | 2,783 |
| Vacant housing units | 412 |
| Total housing units | 3,195 |
| 1-unit, detached | 2,527 |
| 1-unit, attached | 42 |
| 2 units | 0 |
| 3 or 4 units | 0 |
| 5 to 9 units | 0 |
| 10 to 19 units | 126 |
| 20 or more units | 0 |
| Mobile home | 402 |
| Boat, RV, van, etc. | 98 |
| Total housing units | 3,195 |
| Built 2014 or later | 559 |
| Built 2010 to 2013 | 279 |
| Built 2000 to 2009 | 887 |
| Built 1990 to 1999 | 481 |
| Built 1980 to 1989 | 236 |
| Built 1970 to 1979 | 307 |
| Built 1960 to 1969 | 167 |
| Built 1950 to 1959 | 91 |
| Built 1940 to 1949 | 180 |
| Built 1939 or earlier | 8 |
| Total housing units | 3,195 |
| 1 room | 137 |
| 2 rooms | 25 |
| 3 rooms | 89 |
| 4 rooms | 330 |
| 5 rooms | 432 |
| 6 rooms | 708 |
| 7 rooms | 547 |
| 8 rooms | 476 |
| 9 rooms or more | 451 |
| Median rooms | 6.3 |
| Total housing units | 3,195 |
| No bedroom | 137 |
| 1 bedroom | 70 |
| 2 bedrooms | 301 |
| 3 bedrooms | 1,501 |
| 4 bedrooms | 924 |
| 5 or more bedrooms | 262 |
| Occupied housing units | 2,783 |
| Owner-occupied | 2,292 |
| Renter-occupied | 491 |
| Average household size of owner-occupied unit | 3.50 |
| Average household size of renter-occupied unit | 2.29 |
| Occupied housing units | 2,783 |
| Moved in 2017 or later | 231 |
| Moved in 2015 to 2016 | 589 |
| Moved in 2010 to 2014 | 589 |
| Moved in 2000 to 2009 | 658 |
| Moved in 1990 to 1999 | 318 |
| Moved in 1989 and earlier | 398 |
| Owner-occupied units | 2,292 |
| Less than $50,000 | 125 |
| $50,000 to $99,999 | 126 |
| $100,000 to $149,999 | 261 |
| $150,000 to $199,999 | 489 |
| $200,000 to $299,999 | 759 |
| $300,000 to $499,999 | 411 |
| $500,000 to $999,999 | 121 |
| $1,000,000 or more | 0 |
| Median (dollars) | 219,900 |
| Owner-occupied units | 2,292 |
| Housing units with a mortgage | 1,763 |
| Housing units without a mortgage | 529 |
| Occupied units paying rent | 463 |
| Less than $500 | 83 |
| $500 to $999 | 119 |
| $1,000 to $1,499 | 54 |
| $1,500 to $1,999 | 207 |
| $2,000 to $2,499 | 0 |
| $2,500 to $2,999 | 0 |
| $3,000 or more | 0 |
| Median (dollars) | 1,320 |
| No rent paid | 28 |
Data is based on 2018 Census
ZIP Codes for other locations
State for MANVEL
Texas ZIP CodesOther cities in Texas