BATAVIA, OH ZIP Code
| City | BATAVIA |
| State | Ohio |
| ZIP Codes count | 1 (see all) |
| Post offices count | 1 (see all) |
| Total population | 1,762 (see all) |
ZIP Code in BATAVIA, Ohio
45103
This list contains only 5-digit ZIP codes. Use our zip code lookup by address feature to get the full 9-digit (ZIP+4) code.
List of BATAVIA, OH ZIP Codes
| ZIP | TYPE | POPU |
|---|---|---|
| 45103 | STANDARD | 34,948 |
Post offices
BATAVIA — Post Office™ 575 W MAIN ST BATAVIA, OH 45103-9998 |
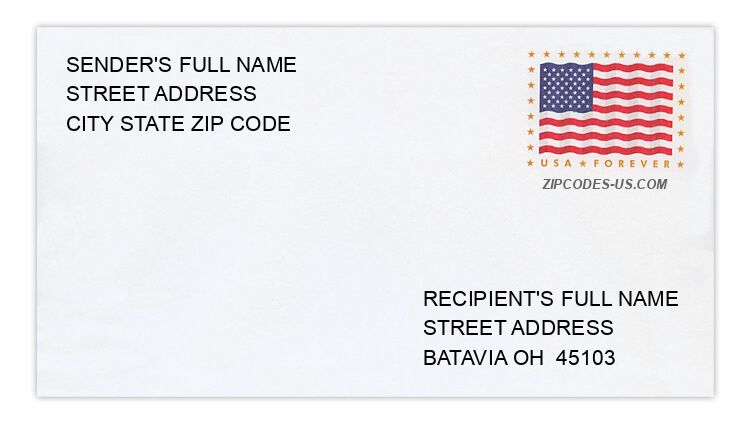
Envelope example
On the bottom center of the envelope, write the address you want your letter delivered to. Include the following on separate lines:
- Recipient's full name
- Full street address
- City, State, and ZIP Code
Using the same format, write the return address in the top left corner.
Using the full ZIP+4 Code when mailing via the USPS ensures the fastest, most accurate mailing possible. If you are not sure of the full 9-digit ZIP Code, use the 5-digit ZIP Code to avoid loss of letter or package.
The recipient address information is provided for your reference.
Address example
2435 BERGEN RD
BATAVIA OH 45103-9585
BATAVIA OH 45103-9585
224 PARK MEADOW DR
BATAVIA OH 45103-7524
BATAVIA OH 45103-7524
4119 SHAYLER XING
BATAVIA OH 45103-2863
BATAVIA OH 45103-2863
2349 SNYDER RD
BATAVIA OH 45103-8980
BATAVIA OH 45103-8980
2129 STONELICK WOODS DR
BATAVIA OH 45103-9120
BATAVIA OH 45103-9120
4531 TIMBERLAKE DR
BATAVIA OH 45103-1012
BATAVIA OH 45103-1012
Map
Hover over the map to see the ZIP code
Census data for BATAVIA, OH
Demographic and housing estimates in BATAVIA, OH
| Total population | 1,762 |
| Male | 807 |
| Female | 955 |
| Total population | 1,762 |
| Under 5 years | 128 |
| 5 to 9 years | 108 |
| 10 to 14 years | 83 |
| 15 to 19 years | 97 |
| 20 to 24 years | 139 |
| 25 to 34 years | 268 |
| 35 to 44 years | 226 |
| 45 to 54 years | 188 |
| 55 to 59 years | 131 |
| 60 to 64 years | 72 |
| 65 to 74 years | 209 |
| 75 to 84 years | 76 |
| 85 years and over | 37 |
| Median age (years) | 37.8 |
| Under 18 years | 377 |
| 16 years and over | 1,434 |
| 18 years and over | 1,385 |
| 21 years and over | 1,343 |
| 62 years and over | 374 |
| 65 years and over | 322 |
| Total population | 1,762 |
| One race | 1,677 |
| White | 1,598 |
| Black or African American | 79 |
| American Indian and Alaska Native | 0 |
| Asian | 0 |
| Native Hawaiian and Other Pacific Islander | 0 |
| Some other race | 0 |
| Two or more races | 85 |
| Citizen, VOTING AGE 18 and over population | 1,385 |
| Male Citizen, VOTING AGE 18 and over population | 609 |
| Female Citizen, VOTING AGE 18 and over population | 776 |
Social characteristics in BATAVIA, OH
| Total households | 664 |
| Family households (families) | 359 |
| Married-couple family | 232 |
| Male householder, no wife present, family | 19 |
| Female householder, no husband present, family | 108 |
| Nonfamily households | 305 |
| Average household size | 2.33 |
| Average family size | 3.22 |
Economic characteristics in BATAVIA, OH
| Total households | 664 |
| Less than $10,000 | 66 |
| $10,000 to $14,999 | 36 |
| $15,000 to $24,999 | 75 |
| $25,000 to $34,999 | 58 |
| $35,000 to $49,999 | 103 |
| $50,000 to $74,999 | 174 |
| $75,000 to $99,999 | 54 |
| $100,000 to $149,999 | 57 |
| $150,000 to $199,999 | 21 |
| $200,000 or more | 20 |
| Median household income (dollars) | 49,375 |
Housing characteristics in BATAVIA, OH
| Total housing units | 790 |
| Occupied housing units | 664 |
| Vacant housing units | 126 |
| Total housing units | 790 |
| 1-unit, detached | 507 |
| 1-unit, attached | 27 |
| 2 units | 43 |
| 3 or 4 units | 47 |
| 5 to 9 units | 94 |
| 10 to 19 units | 28 |
| 20 or more units | 37 |
| Mobile home | 7 |
| Boat, RV, van, etc. | 0 |
| Total housing units | 790 |
| Built 2014 or later | 20 |
| Built 2010 to 2013 | 49 |
| Built 2000 to 2009 | 62 |
| Built 1990 to 1999 | 0 |
| Built 1980 to 1989 | 55 |
| Built 1970 to 1979 | 49 |
| Built 1960 to 1969 | 132 |
| Built 1950 to 1959 | 161 |
| Built 1940 to 1949 | 53 |
| Built 1939 or earlier | 209 |
| Total housing units | 790 |
| 1 room | 36 |
| 2 rooms | 32 |
| 3 rooms | 77 |
| 4 rooms | 121 |
| 5 rooms | 122 |
| 6 rooms | 122 |
| 7 rooms | 129 |
| 8 rooms | 65 |
| 9 rooms or more | 86 |
| Median rooms | 5.6 |
| Total housing units | 790 |
| No bedroom | 39 |
| 1 bedroom | 108 |
| 2 bedrooms | 209 |
| 3 bedrooms | 322 |
| 4 bedrooms | 99 |
| 5 or more bedrooms | 13 |
| Occupied housing units | 664 |
| Owner-occupied | 396 |
| Renter-occupied | 268 |
| Average household size of owner-occupied unit | 2.52 |
| Average household size of renter-occupied unit | 2.06 |
| Occupied housing units | 664 |
| Moved in 2017 or later | 74 |
| Moved in 2015 to 2016 | 85 |
| Moved in 2010 to 2014 | 162 |
| Moved in 2000 to 2009 | 149 |
| Moved in 1990 to 1999 | 95 |
| Moved in 1989 and earlier | 99 |
| Owner-occupied units | 396 |
| Less than $50,000 | 12 |
| $50,000 to $99,999 | 119 |
| $100,000 to $149,999 | 140 |
| $150,000 to $199,999 | 94 |
| $200,000 to $299,999 | 31 |
| $300,000 to $499,999 | 0 |
| $500,000 to $999,999 | 0 |
| $1,000,000 or more | 0 |
| Median (dollars) | 120,200 |
| Owner-occupied units | 396 |
| Housing units with a mortgage | 306 |
| Housing units without a mortgage | 90 |
| Occupied units paying rent | 261 |
| Less than $500 | 55 |
| $500 to $999 | 125 |
| $1,000 to $1,499 | 81 |
| $1,500 to $1,999 | 0 |
| $2,000 to $2,499 | 0 |
| $2,500 to $2,999 | 0 |
| $3,000 or more | 0 |
| Median (dollars) | 694 |
| No rent paid | 7 |
Data is based on 2018 Census
ZIP Codes for other locations
State for BATAVIA
Ohio ZIP CodesOther cities in Ohio